Glaucoma staging study
2021-07-11
Principal components analysis
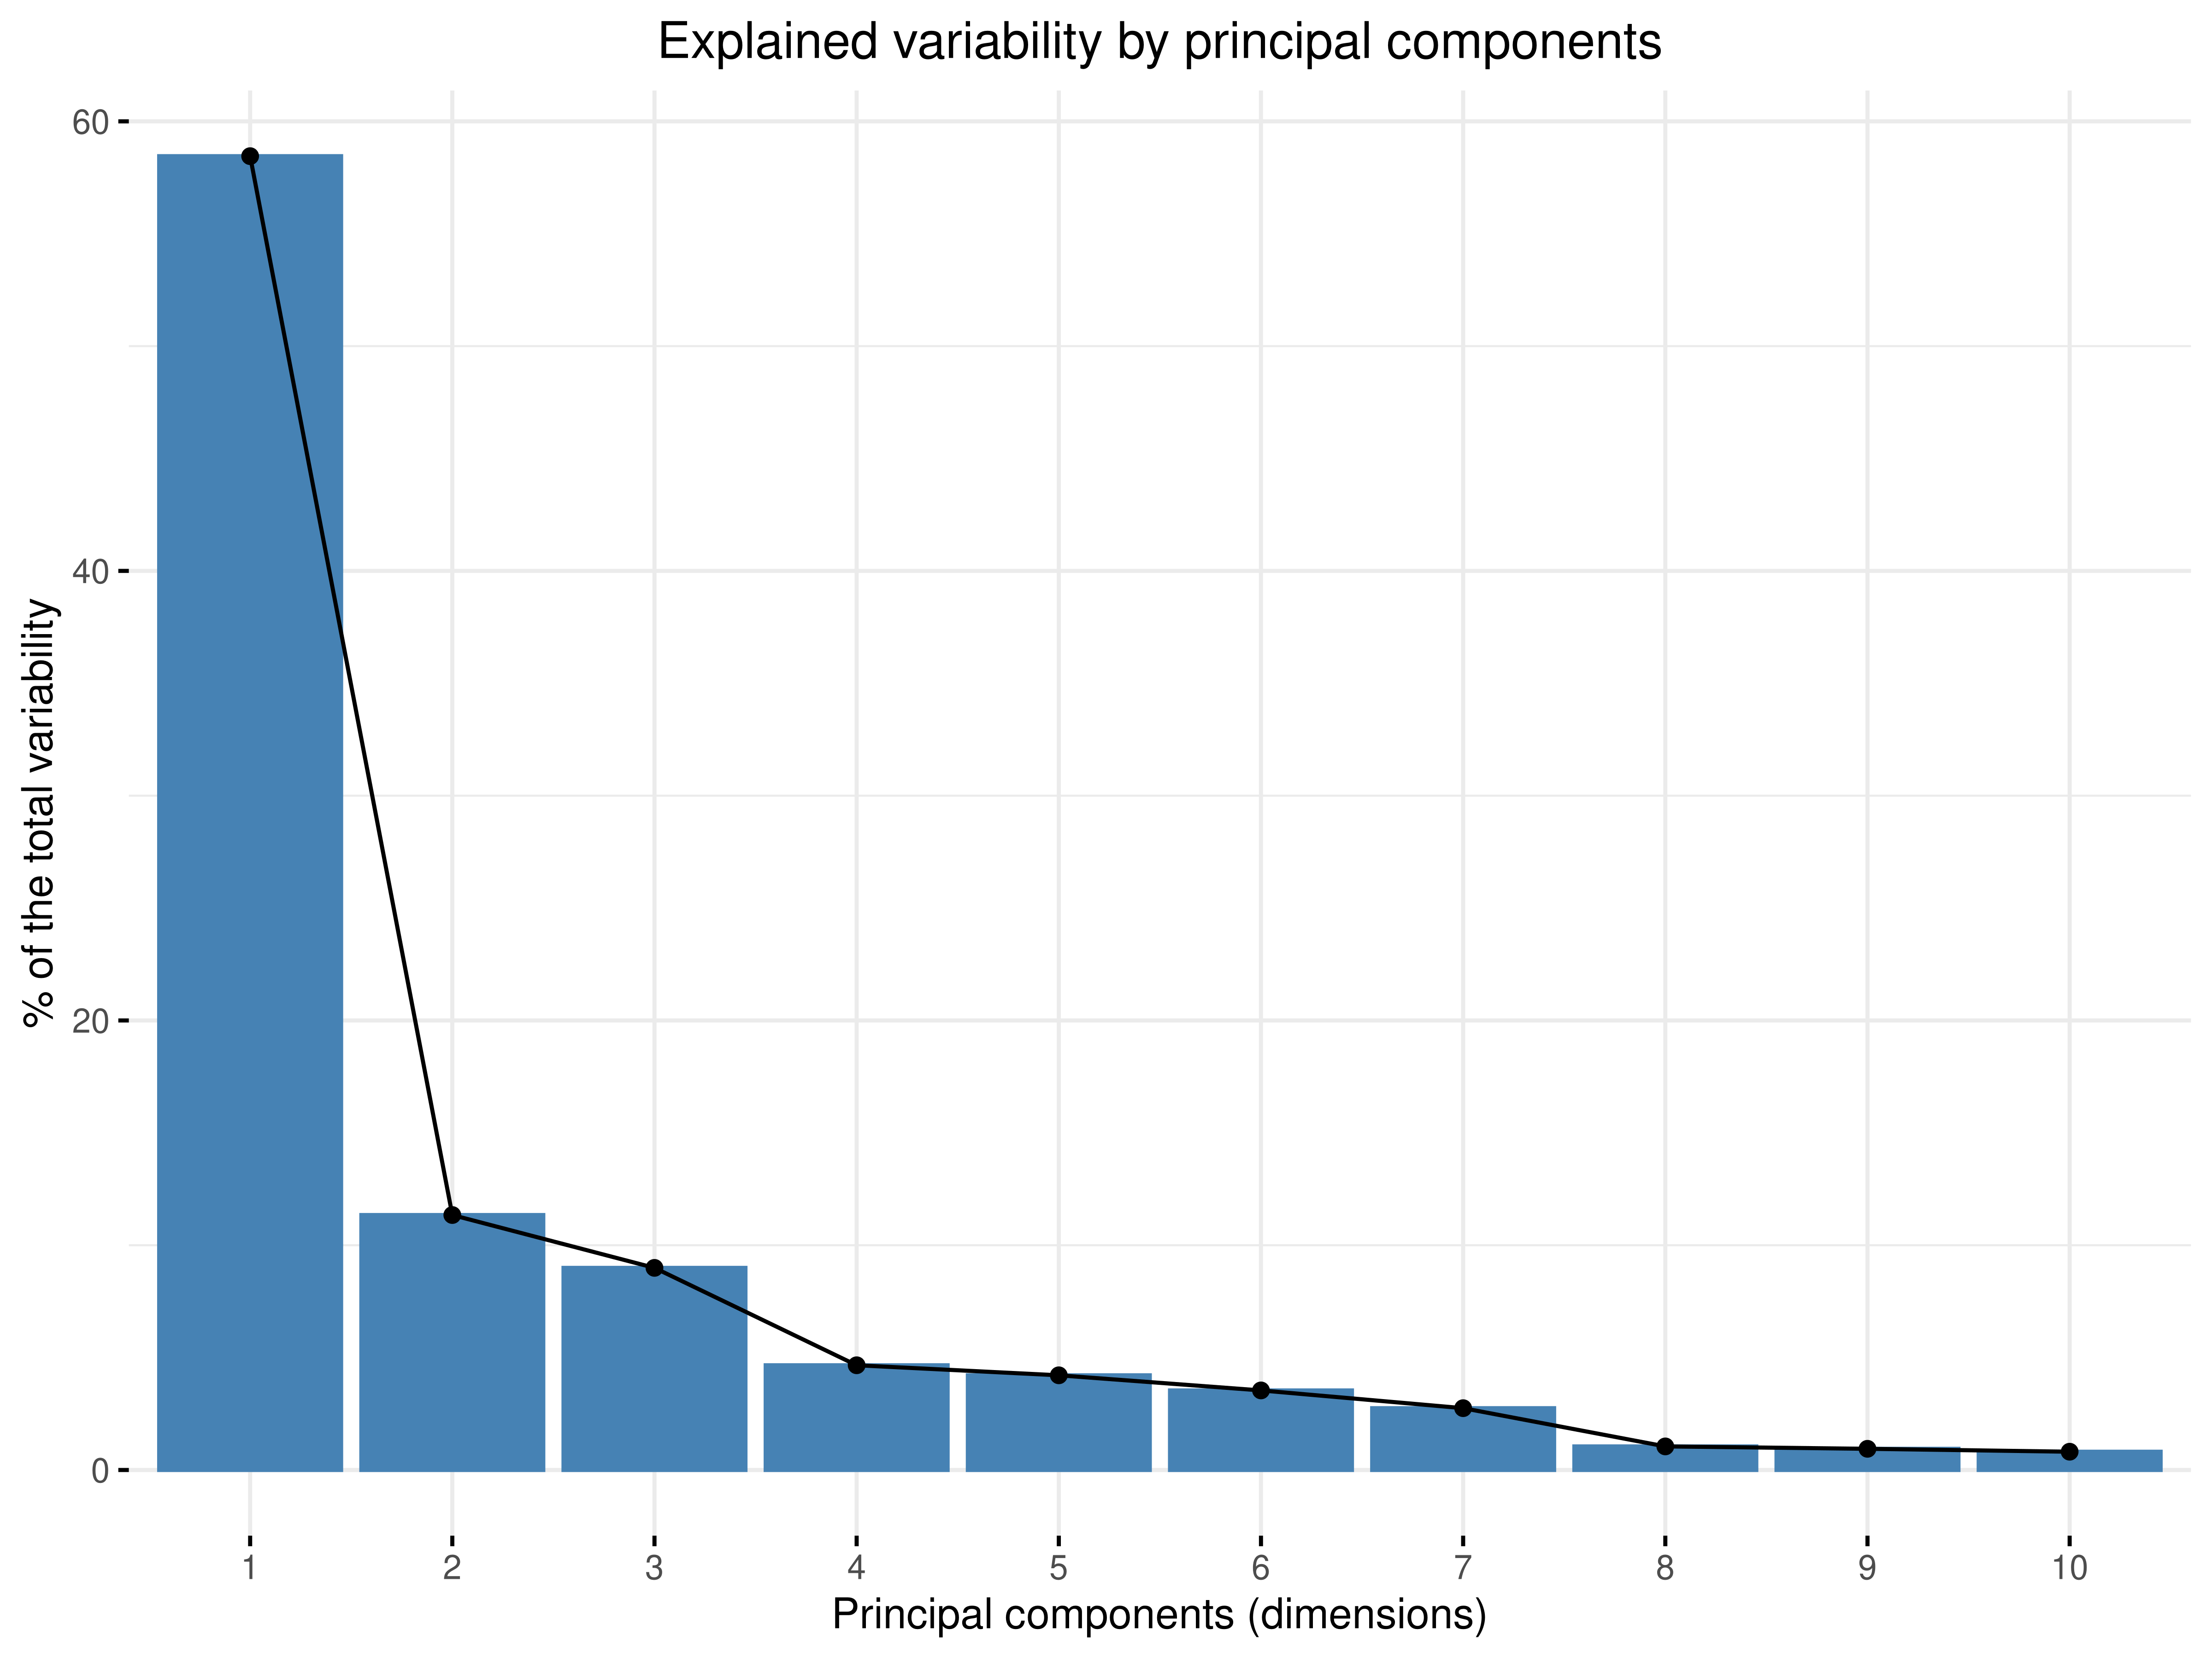
The principal components analysis shows that the first principal component explains almost 60% of the total variability, while the second one only 11%.
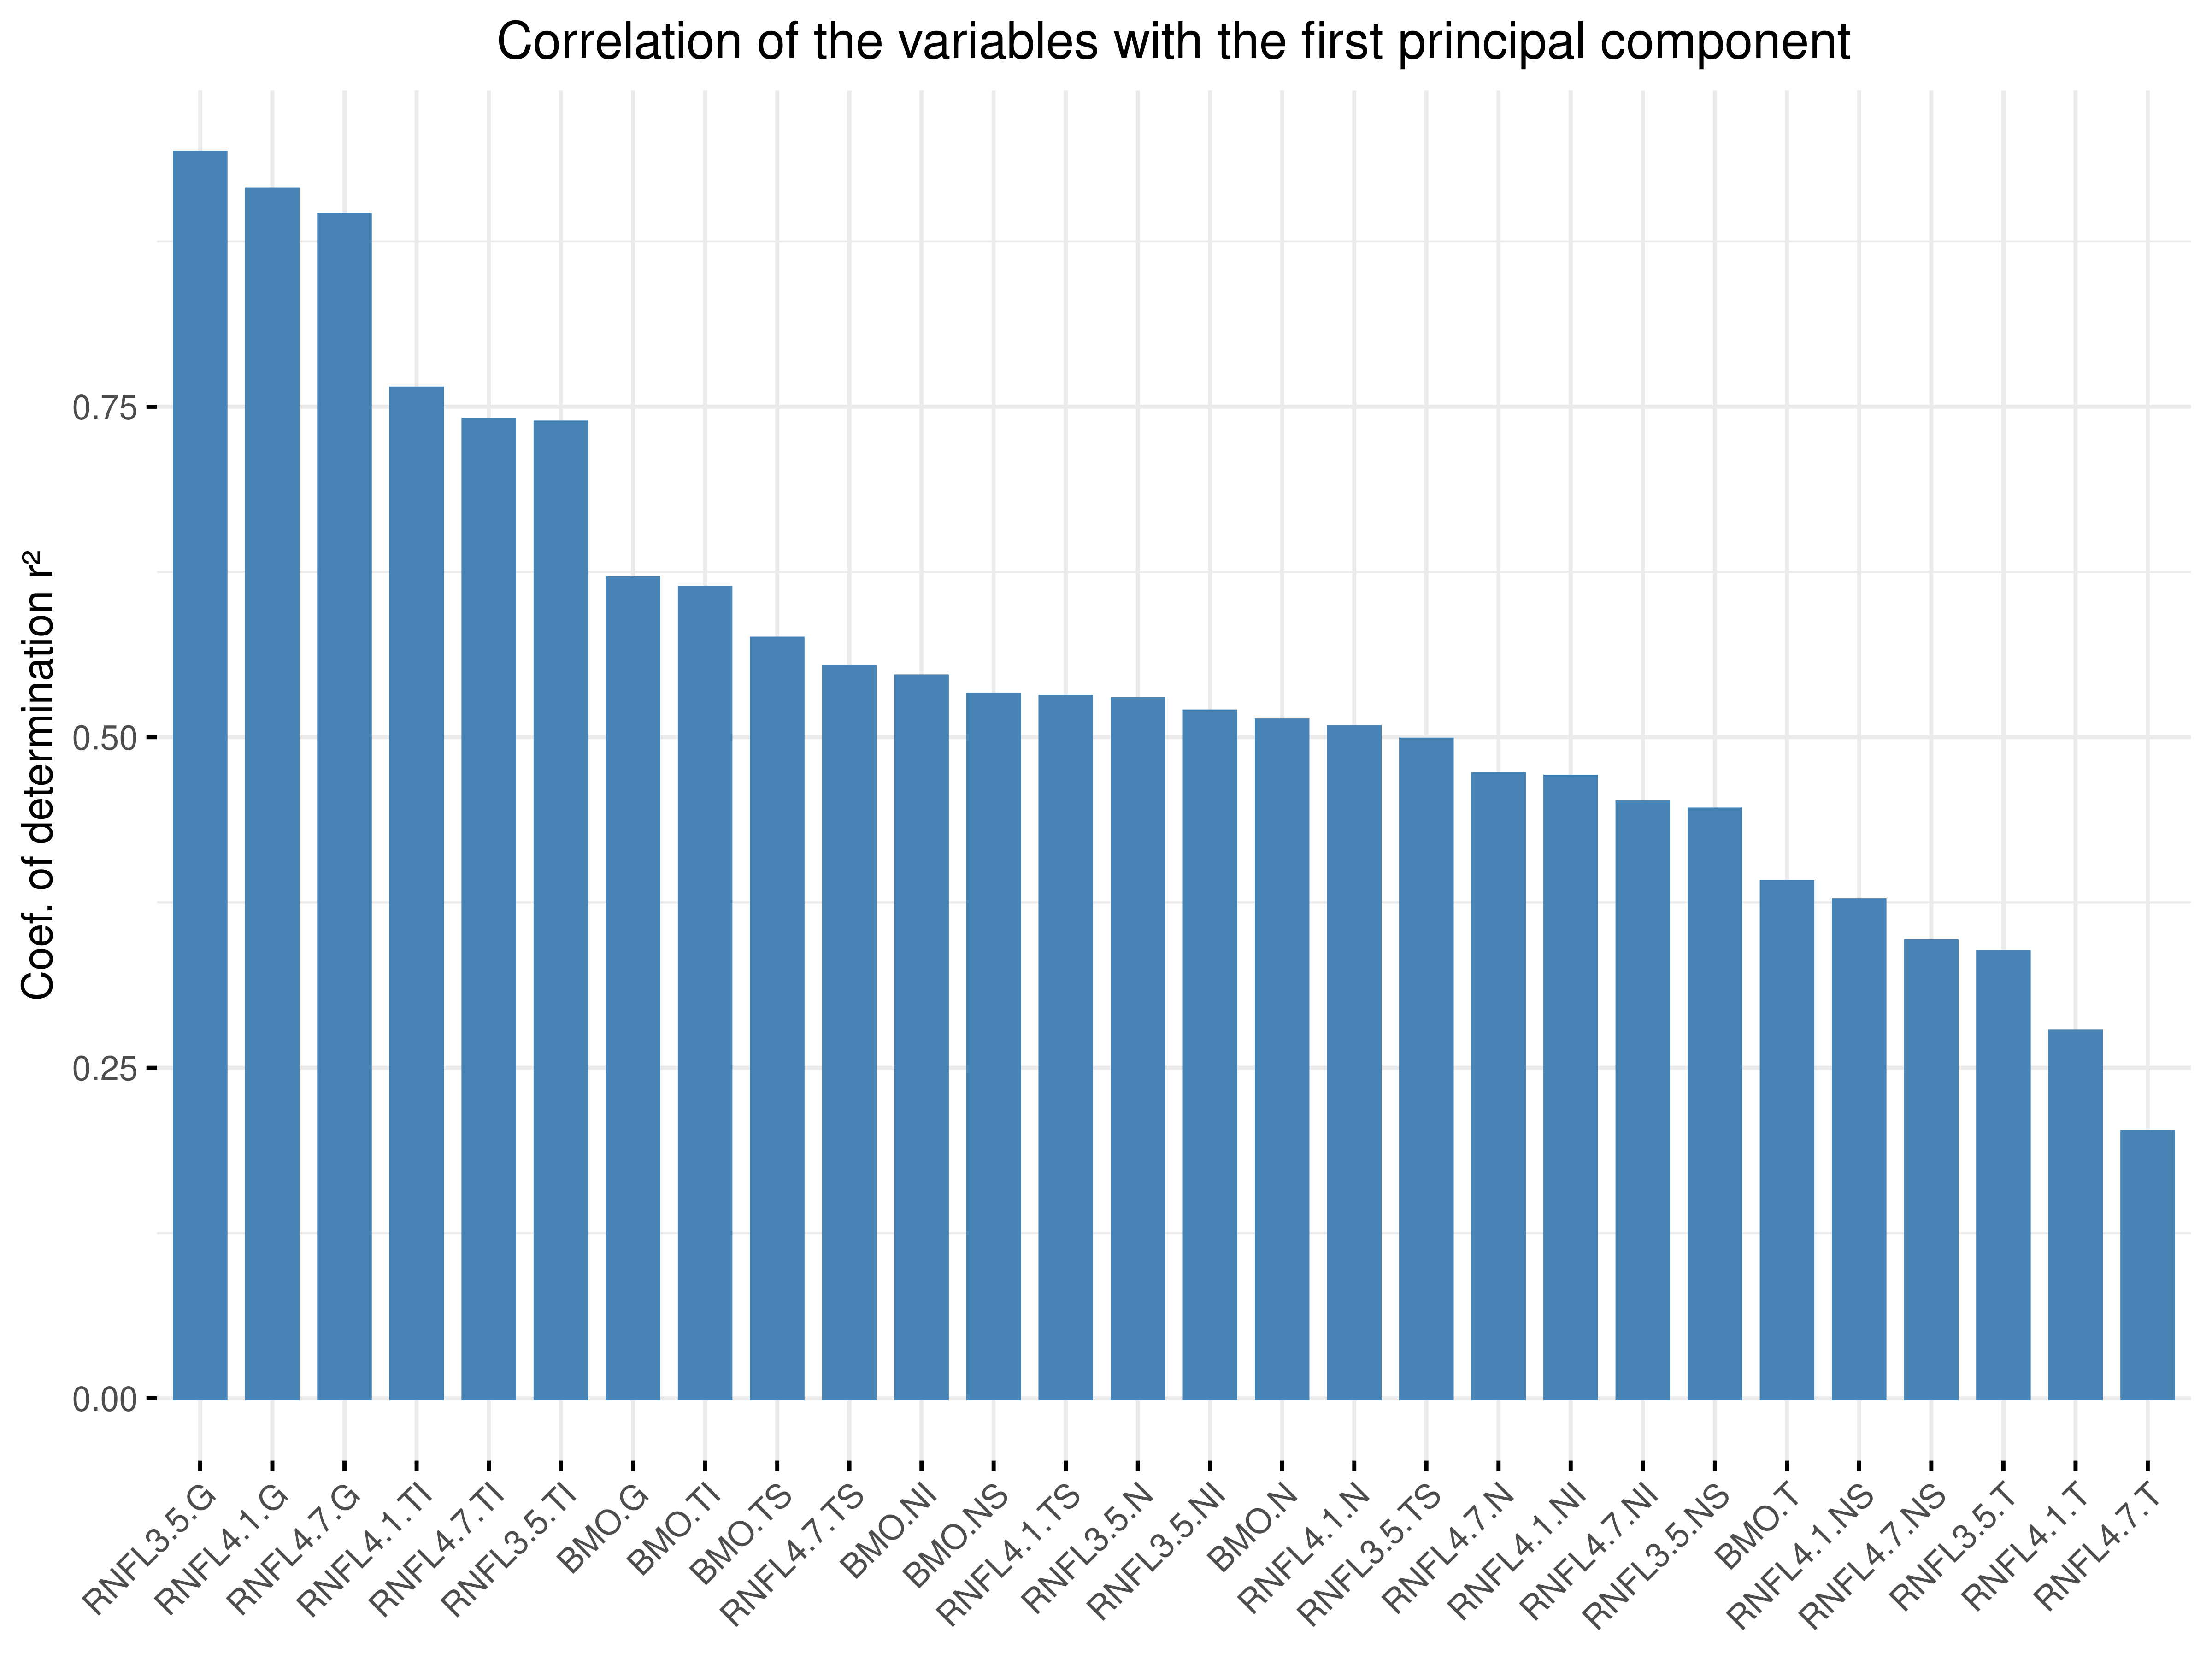
The variables most correlated with the first principal component are the global sector and the TI sector of BMO and RNFL rims.
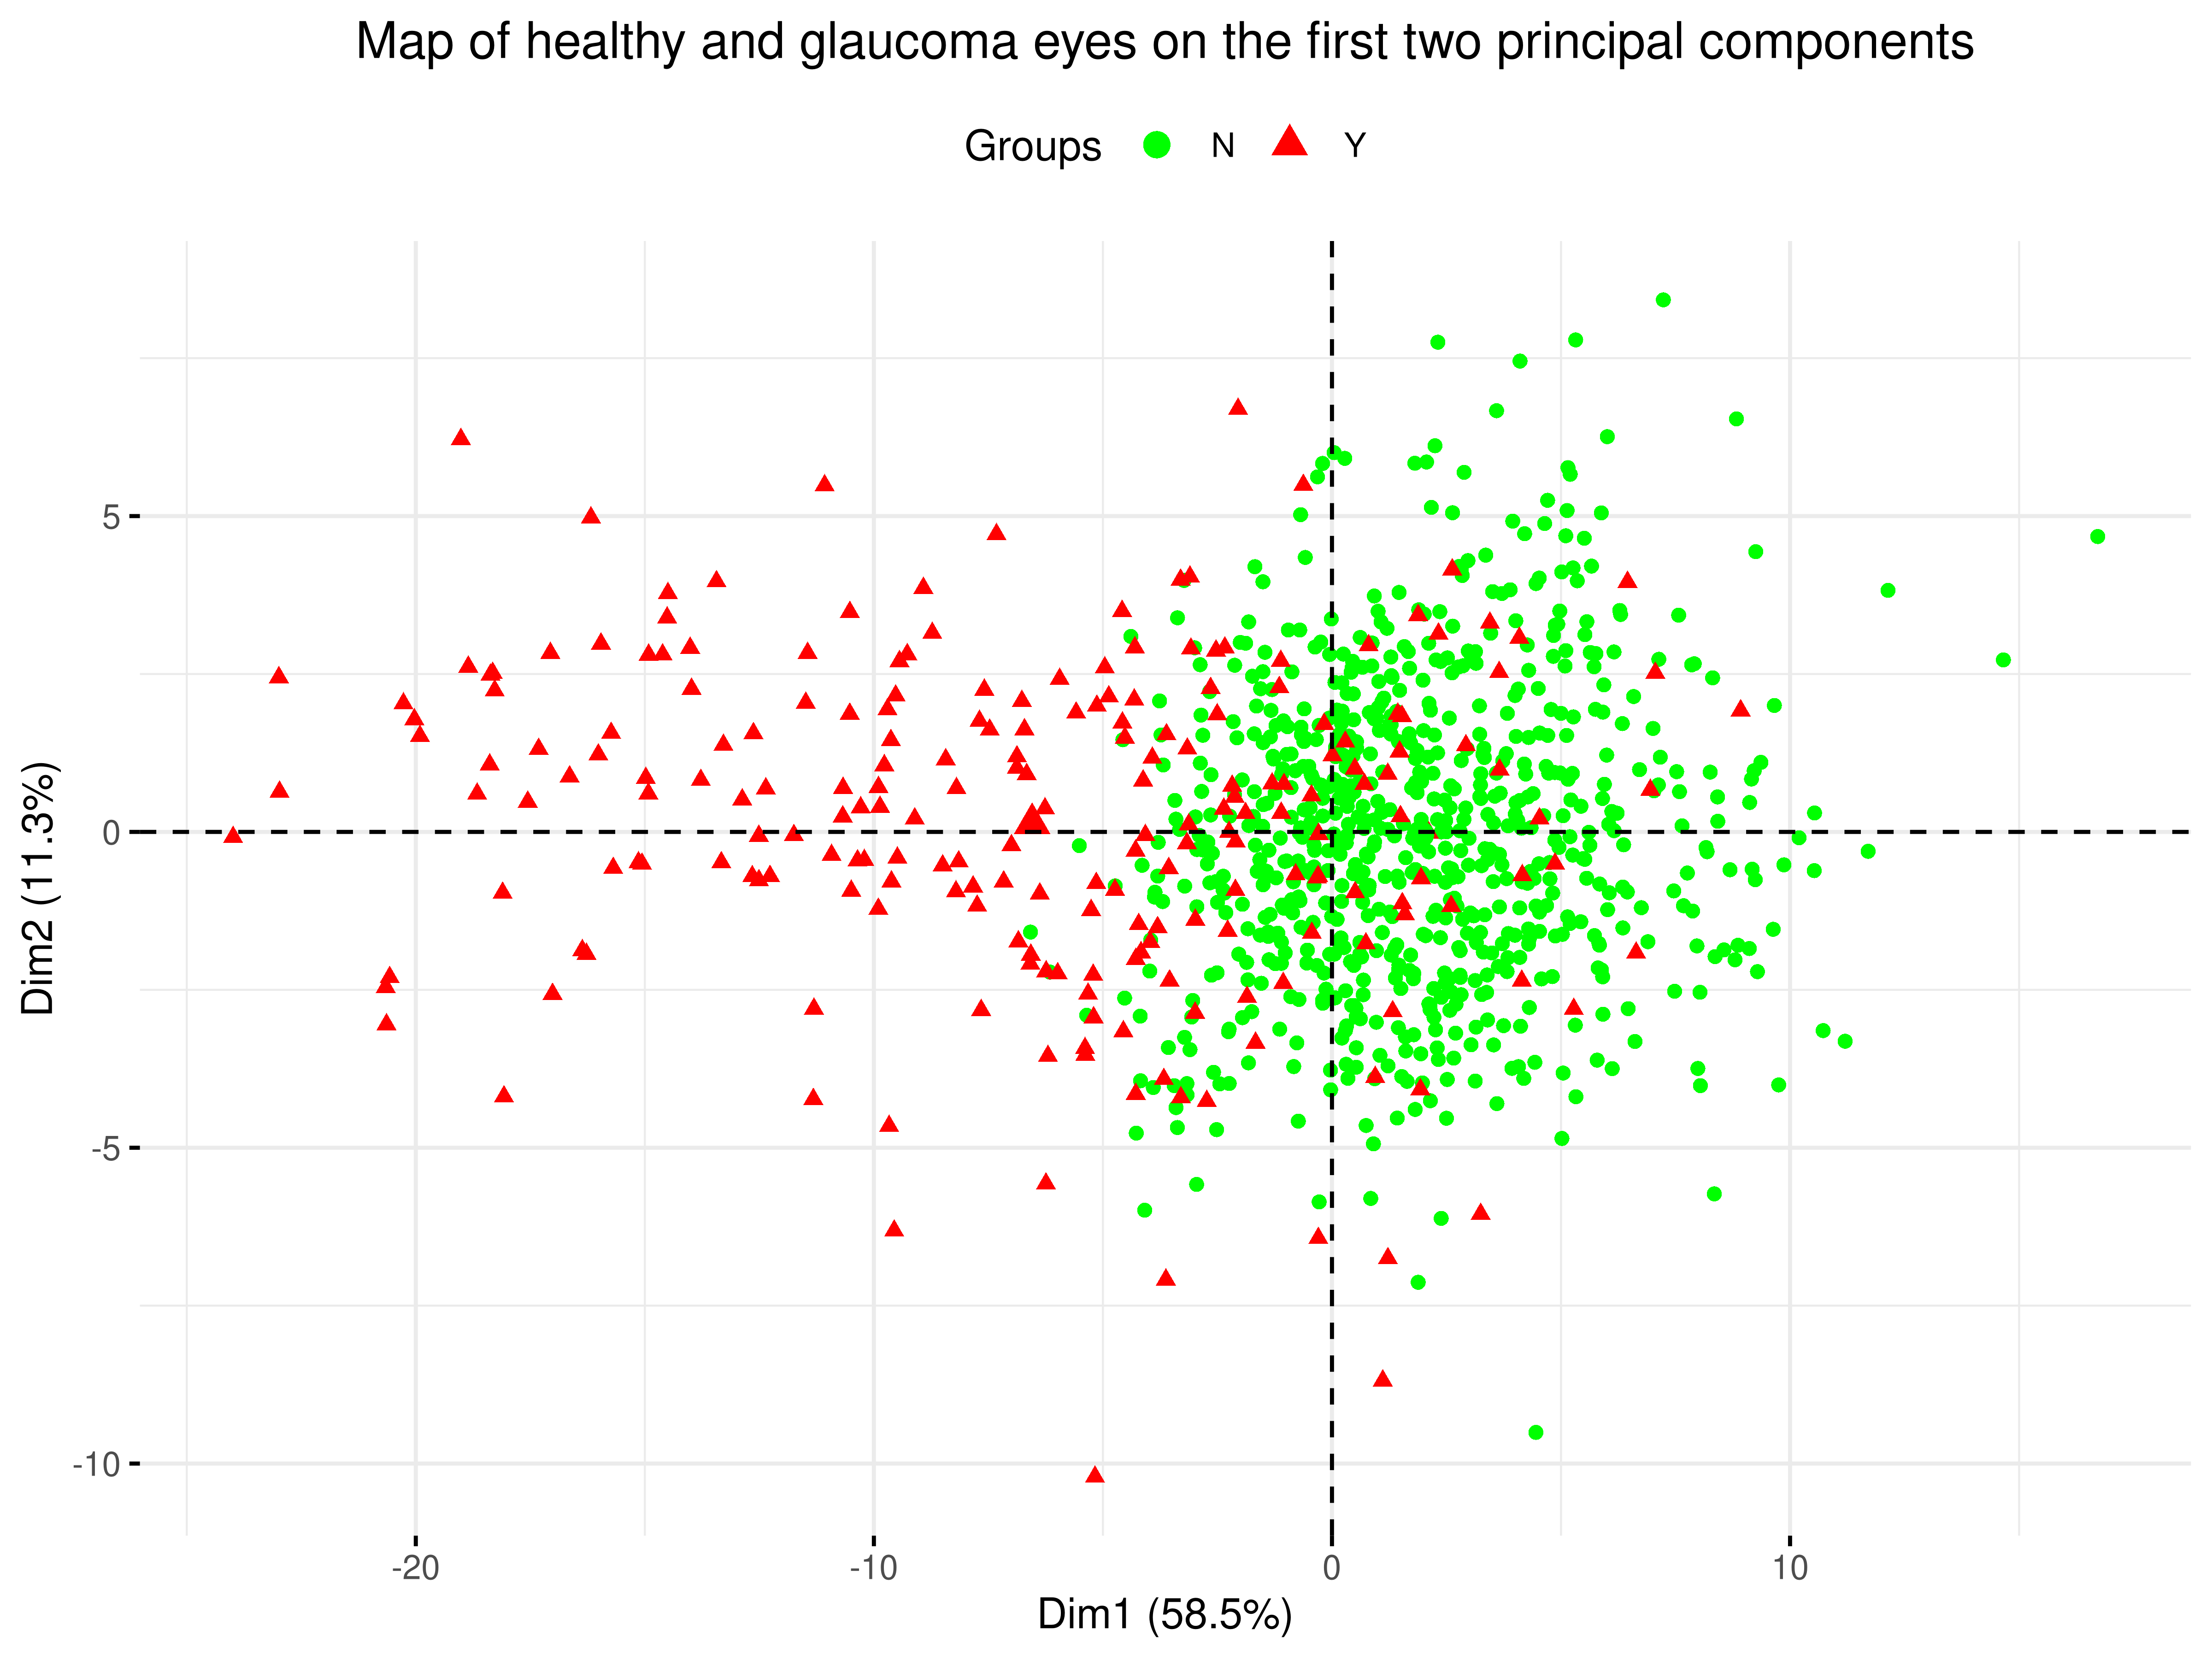
The map shows a clear separation, with a small overlapping area, between healthy and glaucoma eyes along the firs principal component, while there is no separation at all along the second one.