Linear discriminant analysis

Comparison of models

Variable used in the model Overall accuracy without healthy eyes Overall accuracy with healthty eyes
All the variables 0.9292 0.8759
Sectors G and TI of BMO and all the RNFL 0.9381 0.8870
Sectors G of BMO and G and TI of all the RNFL 0.9381 0.8860
Sectors G of BMO and all the RNFL and TI of the RNFL 3.5 0.9425 0.8880
Sectors G and TI of all the RNFL 0.9115 0.8638
Sectors G of BMO and all the RNFL 0.8850 0.8789
Sectors TI of BMO and all the RNFL 0.7080 0.8375
Sectors G and TI of BMO and 3.5 RNFL 0.9204 0.8829
Sectors G of BMO and G and TI of 3.5 RNFL 0.9204 0.8890
Sectors G and TI of BMO 0.5929 0.8375
Sectors G and TI of 3.5 RNFL 0.8894 0.8648
Sector G of BMO and 3.5 RNFL 0.8894 0.8799
Sector TI of BMO and 3.5 RNFL 0.6991 0.8385
Sector G of BMO 0.5664 0.8285
Sector G of 3.5 RNFL 0.8717 0.8557
Sector TI of BMO 0.5973 0.8214
Sector TI of 3.5 RNFL 0.6416 0.8224

Model using all the variables

Confusion matrix without healthy eyes

I II III IV
I 47 2 0 0
II 4 76 3 0
III 0 0 50 4
IV 0 0 3 37

Performance without healthy eyes

Sensitivity Specificity Pos Pred Value Neg Pred Value Precision Recall F1 Prevalence Detection Rate Detection Prevalence Balanced Accuracy
Stage I 0.9216 0.9886 0.9592 0.9774 0.9592 0.9216 0.9400 0.2257 0.2080 0.2168 0.9551
Stage II 0.9744 0.9527 0.9157 0.9860 0.9157 0.9744 0.9441 0.3451 0.3363 0.3673 0.9635
Stage III 0.8929 0.9765 0.9259 0.9651 0.9259 0.8929 0.9091 0.2478 0.2212 0.2389 0.9347
Stage IV 0.9024 0.9838 0.9250 0.9785 0.9250 0.9024 0.9136 0.1814 0.1637 0.1770 0.9431

Confusion matrix with healthy eyes

Healthy I II III IV
Healthy 747 42 36 0 0
I 9 9 2 1 0
II 8 0 36 8 0
III 1 0 4 45 10
IV 0 0 0 2 31

Performance with healthy eyes

Sensitivity Specificity Pos Pred Value Neg Pred Value Precision Recall F1 Prevalence Detection Rate Detection Prevalence Balanced Accuracy
Stage Healthy 0.9765 0.6549 0.9055 0.8916 0.9055 0.9765 0.9396 0.7719 0.7538 0.8325 0.8157
Stage I 0.1765 0.9872 0.4286 0.9567 0.4286 0.1765 0.2500 0.0515 0.0091 0.0212 0.5819
Stage II 0.4615 0.9825 0.6923 0.9553 0.6923 0.4615 0.5538 0.0787 0.0363 0.0525 0.7220
Stage III 0.8036 0.9840 0.7500 0.9882 0.7500 0.8036 0.7759 0.0565 0.0454 0.0605 0.8938
Stage IV 0.7561 0.9979 0.9394 0.9896 0.9394 0.7561 0.8378 0.0414 0.0313 0.0333 0.8770

Model using sectors G of BMO and all the RNFL and sector TI of RNFL

Confusion matrix without healthy eyes

I II III IV
I 47 0 0 0
II 4 75 2 0
III 0 3 54 4
IV 0 0 0 37

Performance without healthy eyes

Sensitivity Specificity Pos Pred Value Neg Pred Value Precision Recall F1 Prevalence Detection Rate Detection Prevalence Balanced Accuracy
Stage I 0.9216 1.0000 1.0000 0.9777 1.0000 0.9216 0.9592 0.2257 0.2080 0.2080 0.9608
Stage II 0.9615 0.9595 0.9259 0.9793 0.9259 0.9615 0.9434 0.3451 0.3319 0.3584 0.9605
Stage III 0.9643 0.9588 0.8852 0.9879 0.8852 0.9643 0.9231 0.2478 0.2389 0.2699 0.9616
Stage IV 0.9024 1.0000 1.0000 0.9788 1.0000 0.9024 0.9487 0.1814 0.1637 0.1637 0.9512

Confusion matrix with healthy eyes

Healthy I II III IV
Healthy 754 49 35 2 0
I 4 2 0 0 0
II 6 0 40 4 0
III 1 0 3 49 6
IV 0 0 0 1 35

Performance with healthy eyes

Sensitivity Specificity Pos Pred Value Neg Pred Value Precision Recall F1 Prevalence Detection Rate Detection Prevalence Balanced Accuracy
Stage Healthy 0.9856 0.6195 0.8976 0.9272 0.8976 0.9856 0.9396 0.7719 0.7608 0.8476 0.8025
Stage I 0.0392 0.9957 0.3333 0.9503 0.3333 0.0392 0.0702 0.0515 0.0020 0.0061 0.5175
Stage II 0.5128 0.9890 0.8000 0.9596 0.8000 0.5128 0.6250 0.0787 0.0404 0.0505 0.7509
Stage III 0.8750 0.9893 0.8305 0.9925 0.8305 0.8750 0.8522 0.0565 0.0494 0.0595 0.9322
Stage IV 0.8537 0.9989 0.9722 0.9937 0.9722 0.8537 0.9091 0.0414 0.0353 0.0363 0.9263

Model using sectors G and TI of BMO and RNFL 3.5

Discriminant functions without healthy eyes

Coefficients of the linear discriminant functions:

LD1 LD2 LD3
BMO.G -0.1881 0.7502 -0.9165
BMO.TI -0.0943 -0.2901 1.5660
RNFL3.5.G -0.8857 0.4810 0.0849
RNFL3.5.TI -0.4108 -0.6927 -0.5217

Confusion matrix without healthy eyes

I II III IV
I 45 0 0 0
II 6 75 4 0
III 0 3 50 3
IV 0 0 2 38

Performance without healthy eyes

Sensitivity Specificity Pos Pred Value Neg Pred Value Precision Recall F1 Prevalence Detection Rate Detection Prevalence Balanced Accuracy
Stage I 0.8824 1.0000 1.0000 0.9669 1.0000 0.8824 0.9375 0.2257 0.1991 0.1991 0.9412
Stage II 0.9615 0.9324 0.8824 0.9787 0.8824 0.9615 0.9202 0.3451 0.3319 0.3761 0.9470
Stage III 0.8929 0.9647 0.8929 0.9647 0.8929 0.8929 0.8929 0.2478 0.2212 0.2478 0.9288
Stage IV 0.9268 0.9892 0.9500 0.9839 0.9500 0.9268 0.9383 0.1814 0.1681 0.1770 0.9580

Discriminant functions with healthy eyes

Coefficients of the linear discriminant functions:

LD1 LD2 LD3 LD4
BMO.G -0.2069 1.2241 -0.2007 -1.1987
BMO.TI -0.1555 -0.4096 -0.2255 1.7378
RNFL3.5.G -0.6034 -0.1298 1.0720 0.2322
RNFL3.5.TI -0.2950 -0.4165 -0.8337 -0.6390

Confusion matrix with healthy eyes

Healthy I II III IV
Healthy 755 50 38 2 0
I 2 0 0 0 0
II 7 1 37 7 0
III 1 0 3 46 4
IV 0 0 0 1 37

Performance with healthy eyes

Sensitivity Specificity Pos Pred Value Neg Pred Value Precision Recall F1 Prevalence Detection Rate Detection Prevalence Balanced Accuracy
Stage Healthy 0.9869 0.6018 0.8935 0.9315 0.8935 0.9869 0.9379 0.7719 0.7619 0.8527 0.7943
Stage I 0.0000 0.9979 0.0000 0.9484 0.0000 0.0000 NaN 0.0515 0.0000 0.0020 0.4989
Stage II 0.4744 0.9836 0.7115 0.9563 0.7115 0.4744 0.5692 0.0787 0.0373 0.0525 0.7290
Stage III 0.8214 0.9914 0.8519 0.9893 0.8519 0.8214 0.8364 0.0565 0.0464 0.0545 0.9064
Stage IV 0.9024 0.9989 0.9737 0.9958 0.9737 0.9024 0.9367 0.0414 0.0373 0.0383 0.9507

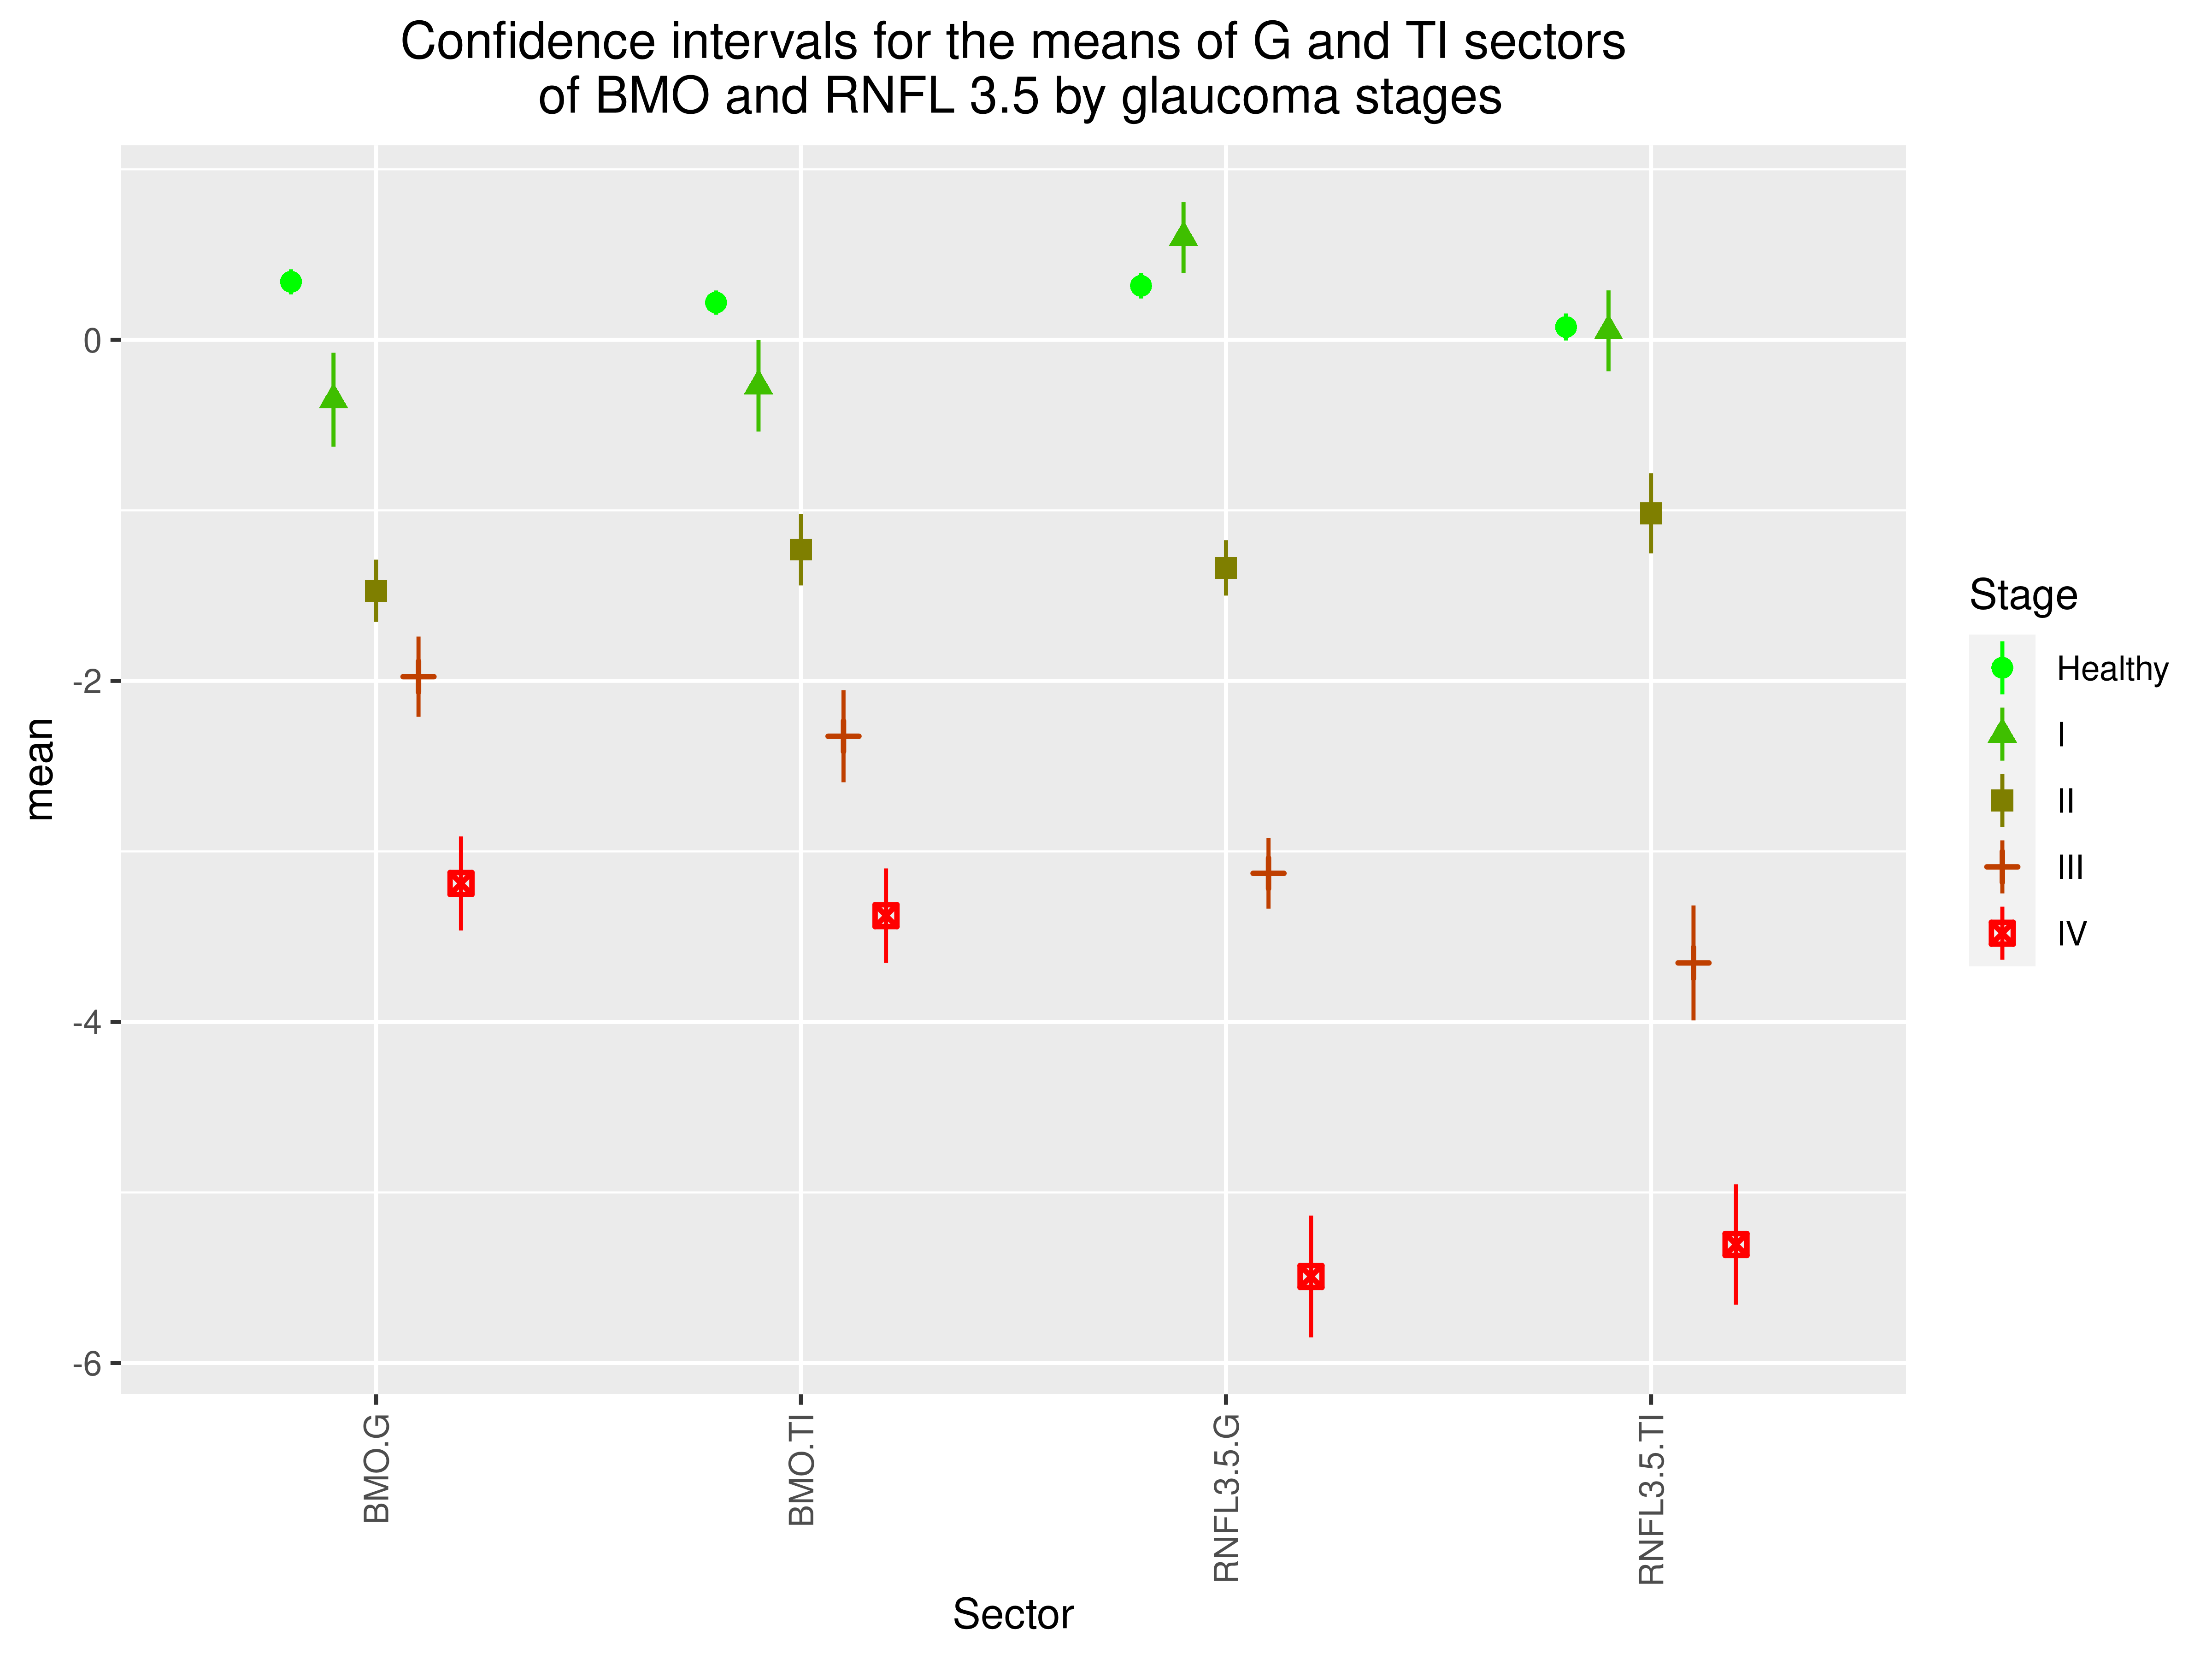
Main statistics for the distribution of BMO.G, Rim3.5.G and Rim3.5.TI by stages

Sector Stage n mean sd se lower.ci upper.ci
BMO.G Healthy 765 0.3400 1.0372 0.0375 0.2664 0.4136
BMO.G I 51 -0.3516 0.9794 0.1372 -0.6271 -0.0762
BMO.G II 78 -1.4718 0.8091 0.0916 -1.6542 -1.2894
BMO.G III 56 -1.9757 0.8783 0.1174 -2.2109 -1.7405
BMO.G IV 41 -3.1883 0.8738 0.1365 -3.4641 -2.9125
BMO.TI Healthy 765 0.2184 0.9992 0.0361 0.1475 0.2893
BMO.TI I 51 -0.2698 0.9536 0.1335 -0.5380 -0.0016
BMO.TI II 78 -1.2304 0.9312 0.1054 -1.4404 -1.0205
BMO.TI III 56 -2.3249 1.0073 0.1346 -2.5946 -2.0551
BMO.TI IV 41 -3.3770 0.8779 0.1371 -3.6541 -3.0999
RNFL3.5.G Healthy 765 0.3165 1.0444 0.0378 0.2423 0.3906
RNFL3.5.G I 51 0.6000 0.7404 0.1037 0.3918 0.8082
RNFL3.5.G II 78 -1.3375 0.7206 0.0816 -1.4999 -1.1750
RNFL3.5.G III 56 -3.1287 0.7729 0.1033 -3.3357 -2.9218
RNFL3.5.G IV 41 -5.4930 1.1323 0.1768 -5.8504 -5.1356
RNFL3.5.TI Healthy 765 0.0750 1.1143 0.0403 -0.0040 0.1541
RNFL3.5.TI I 51 0.0527 0.8429 0.1180 -0.1843 0.2898
RNFL3.5.TI II 78 -1.0176 1.0403 0.1178 -1.2522 -0.7831
RNFL3.5.TI III 56 -3.6541 1.2586 0.1682 -3.9912 -3.3171
RNFL3.5.TI IV 41 -5.3054 1.1174 0.1745 -5.6580 -4.9527