- Correlation analysis
Glaucoma staging study
2021-07-11
Correlation analysis
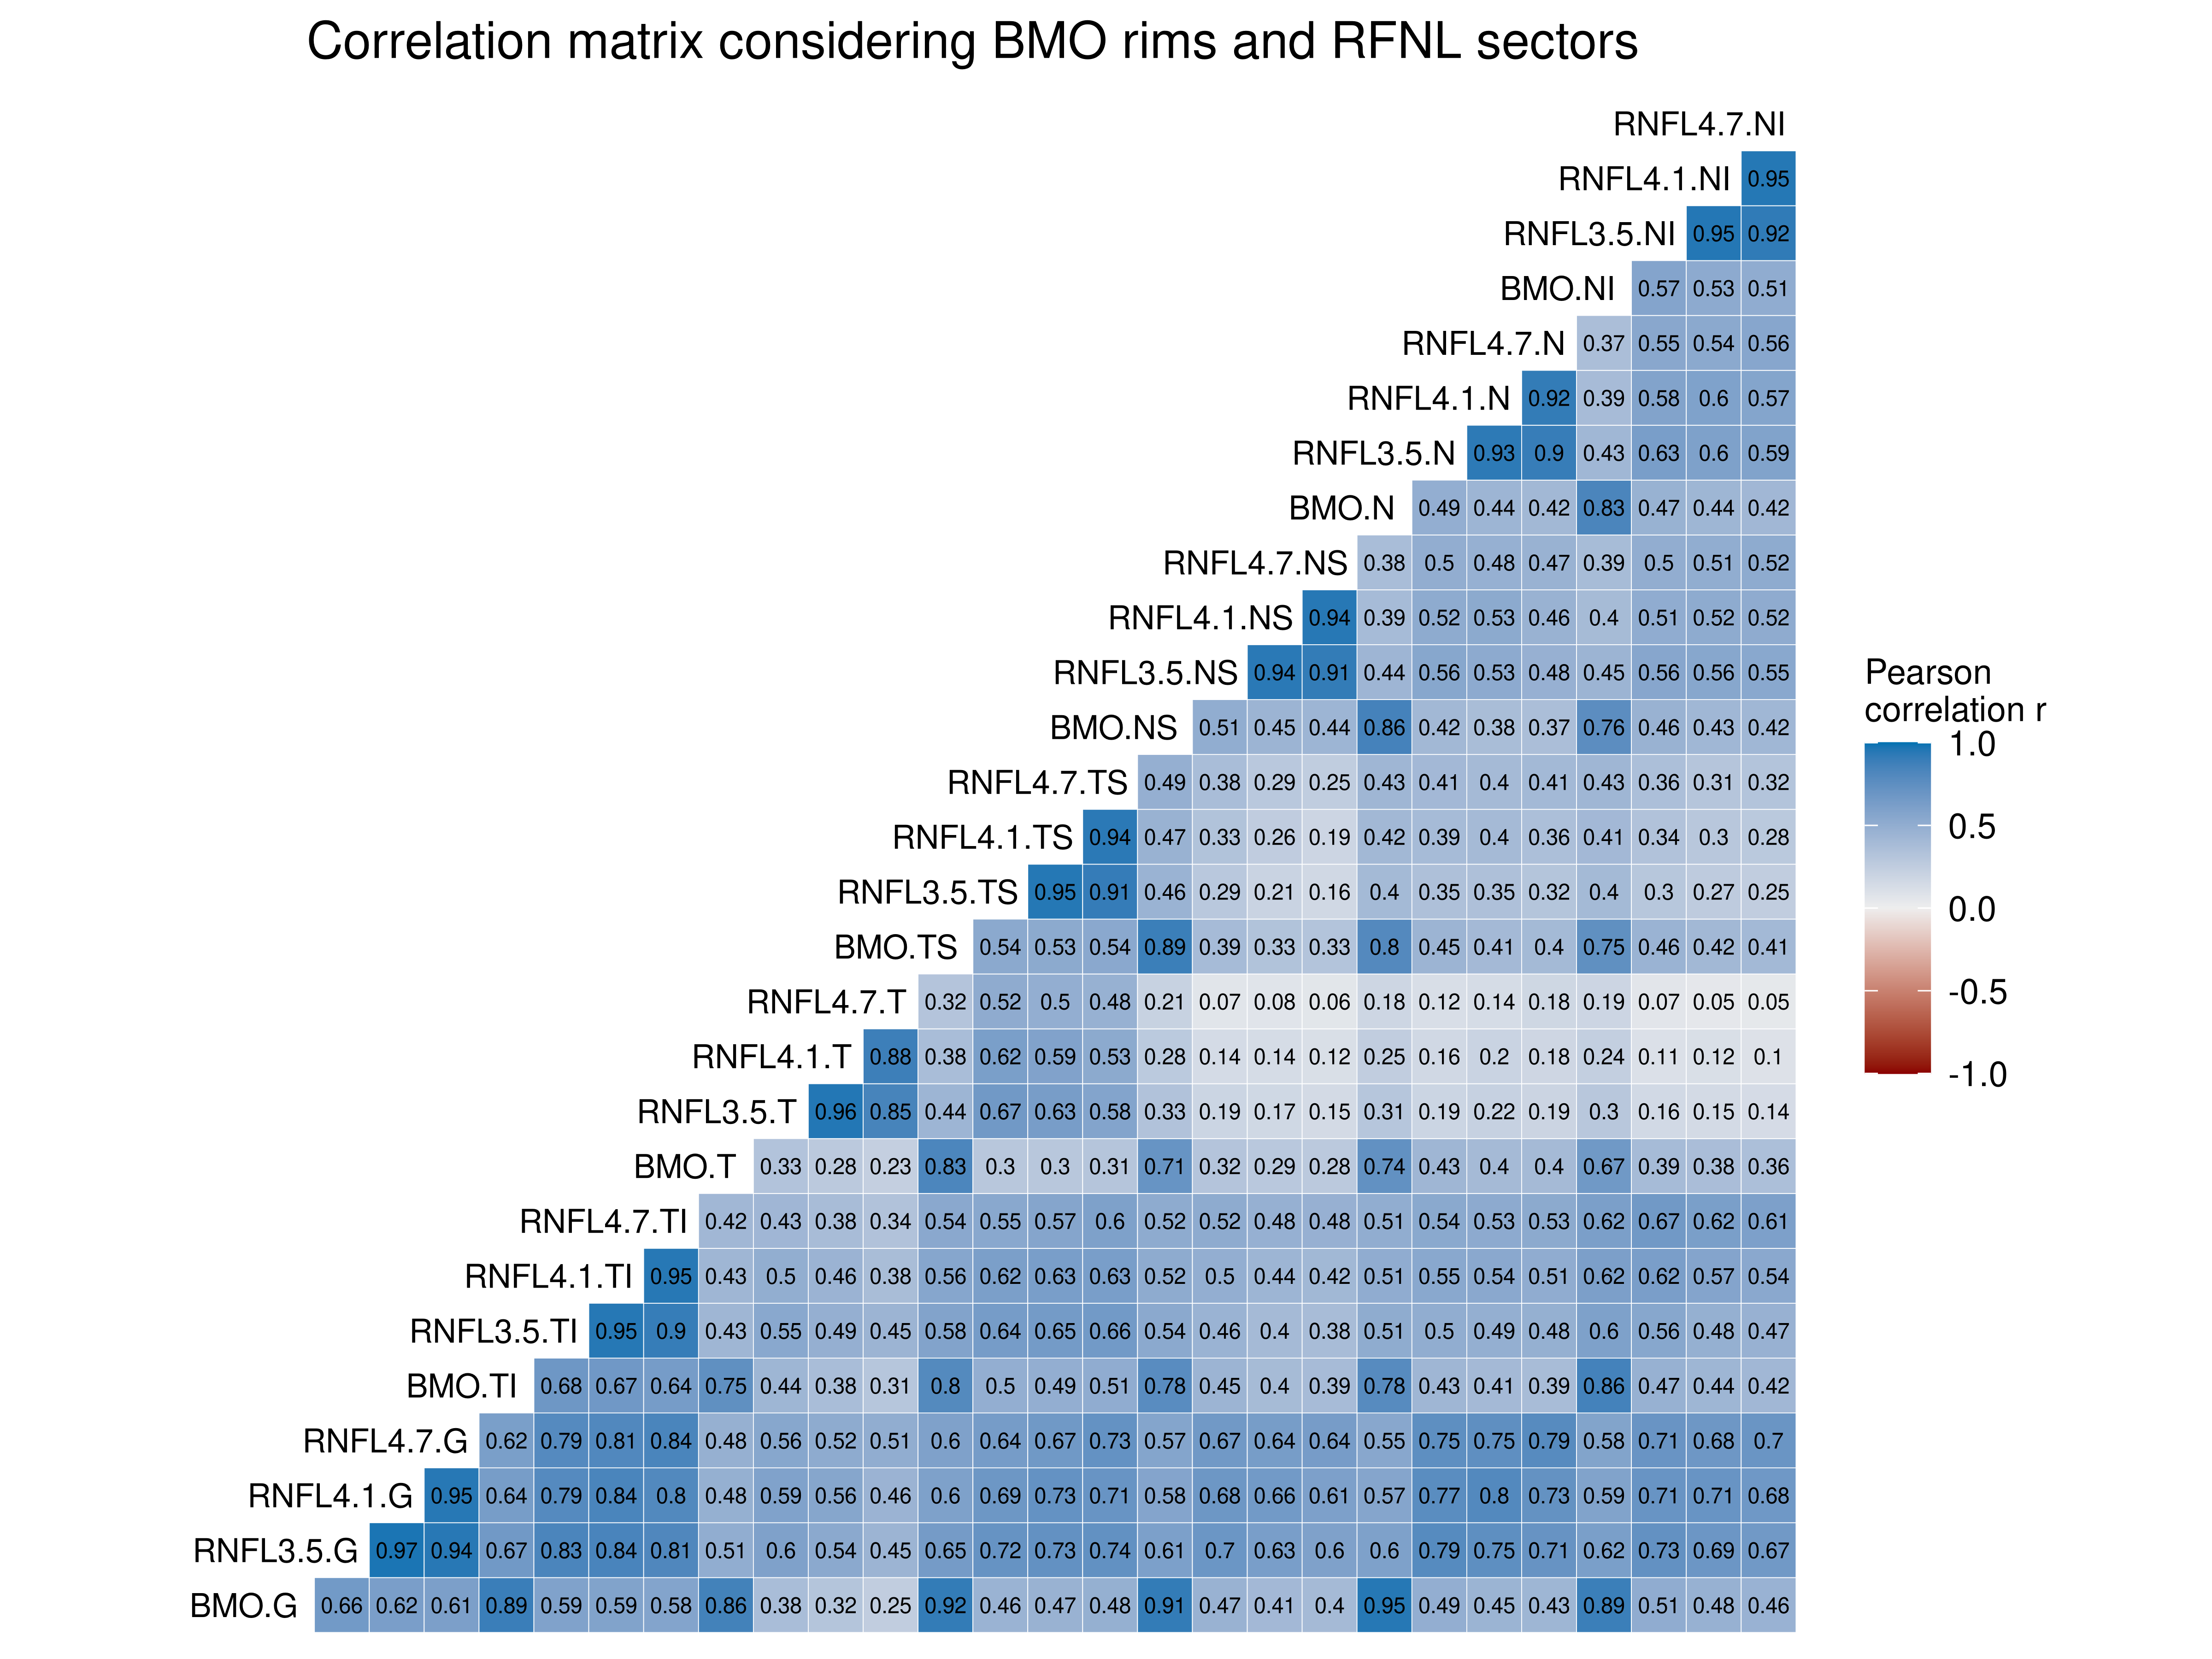
The correlation analysis showed a clear correlation pattern by sectors. There was a very strong correlation (r>0.9) among the thickness of the BMO and RNFL rims 3.5, 4.1 and 4.7 by sectors. There was also a strong correlation (r>0.75) among the sectors of the BMO, except the BMO.G, that presented a very strong correlation with the others sectors. On the other hand, there was a very weak correlation (r<0.2) between the T sector and the N, NI and NS sectors. The T sector was in fact, the less correlated with the rest.